Oceanside, CA Rental Market 2025: Your Essential Guide
Oceanside, CA Rental Market 2025: Your Essential Guide to Trends, Affordability, and What's Next
Welcome, renters, landlords, and real estate enthusiasts! If you're looking to understand the dynamic residential rental market in Oceanside, California, for 2025, you've come to the right place. This comprehensive analysis, packed with insights and data-driven projections, will help you navigate this vibrant coastal city's rental landscape. We'll explore current trends, average rents, vacancy rates, and key factors influencing the market.
Key SEO Keywords:
Oceanside CA rental market 2025, Oceanside rent trends, average rent Oceanside CA, Oceanside rental prices, Oceanside vacancy rate, Oceanside real estate investment, Oceanside housing market forecast.
Oceanside's Rental Market Snapshot: Key Statistics for 2025
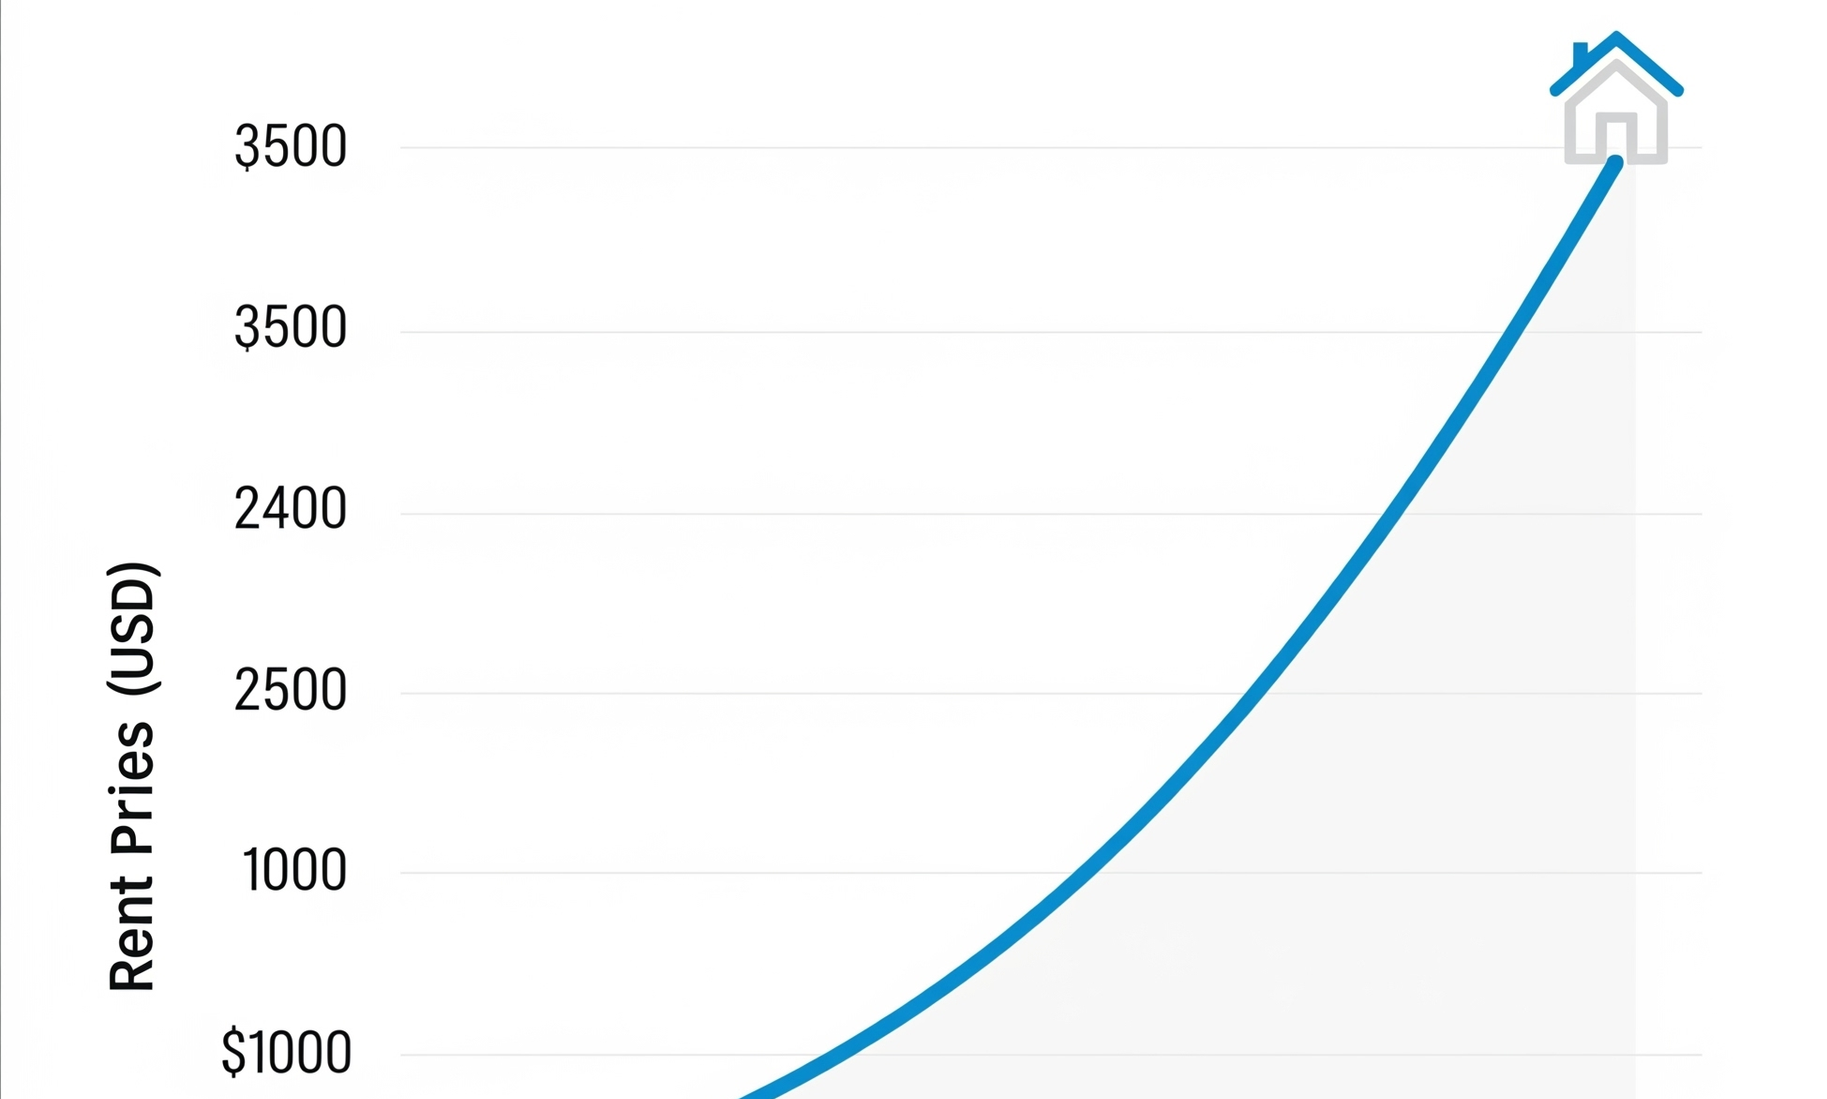
As of July 2025, Apartments.com reports an average rent of $2,176/month. This varies by property type:
Apartments: Studio $1,867, 1-Bed $2,176, 2-Bed $2,660, 3-Bed $3,350
Despite fluctuations, rents remain well above national averages.
Supply and Demand
Oceanside's vacancy rate is ~3%, below the ideal 5–6%. The national average is 7%, showing how tight local supply is. Zillow shows 705 rentals, Zumper 198, and Realtor.com 145 homes downtown.
New Housing Developments
New construction focuses on for-sale homes—many luxury—like North River Farms ($954K–$1.4M) and Vista Pacific ($1.7M+). These don't relieve rental supply pressures.
Short-Term Rentals
March 2025: 974 Airbnb listings; November 2024: 1,354 listings. These reduce long-term availability. Average yield is 6.75%, annual revenue ~$61,170.
Affordability and Rent Burden
Median household income in Oceanside (2023): $93,724. Renters ideally need $87,036 annually to afford $2,176/month. Yet, 74% of low-income renters spend over 30% on rent; 44% spend over 50%.
Cost of Living
San Diego metro COLI is 147.2. Oceanside is 40% more expensive than the national average. The rent vs. buy ratio (~24) suggests renting is more economical for most.
Policy Landscape
March 2025: Oceanside proposed tenant protections—relocation aid, rent caps, eviction limits. Final policy (April 2025): 1-month relocation rent. AB 1482 (state law) limits rent hikes to 8.8% in SD County for 2025–2026.
Conclusion
Oceanside's 2025 rental market is tight, high-demand, and costly. Rents may stabilize, but affordability issues remain. Renters should be budget-ready; landlords have strong demand and short-term rental options, but must track evolving policy.
SEO Keywords:
Oceanside rental market forecast, Oceanside housing market 2025, investing in Oceanside real estate, Oceanside landlord guide, Oceanside renter tips, affordable housing Oceanside.
Why saying yes to pets can increase your rental income, attract more tenants, and more stable leases. Discover the surprising benefits of a pet-friendly policy.
A landlord's guide to the eviction process in San Diego. Learn about legal grounds, the step-by-step process, and key considerations to protect your property.
Struggling to rent your property? Discover how a professional market analysis can help you price your home correctly, reduce vacancy, and maximize your rental income