Bonsall Rental Market 2025: Jan–May Update
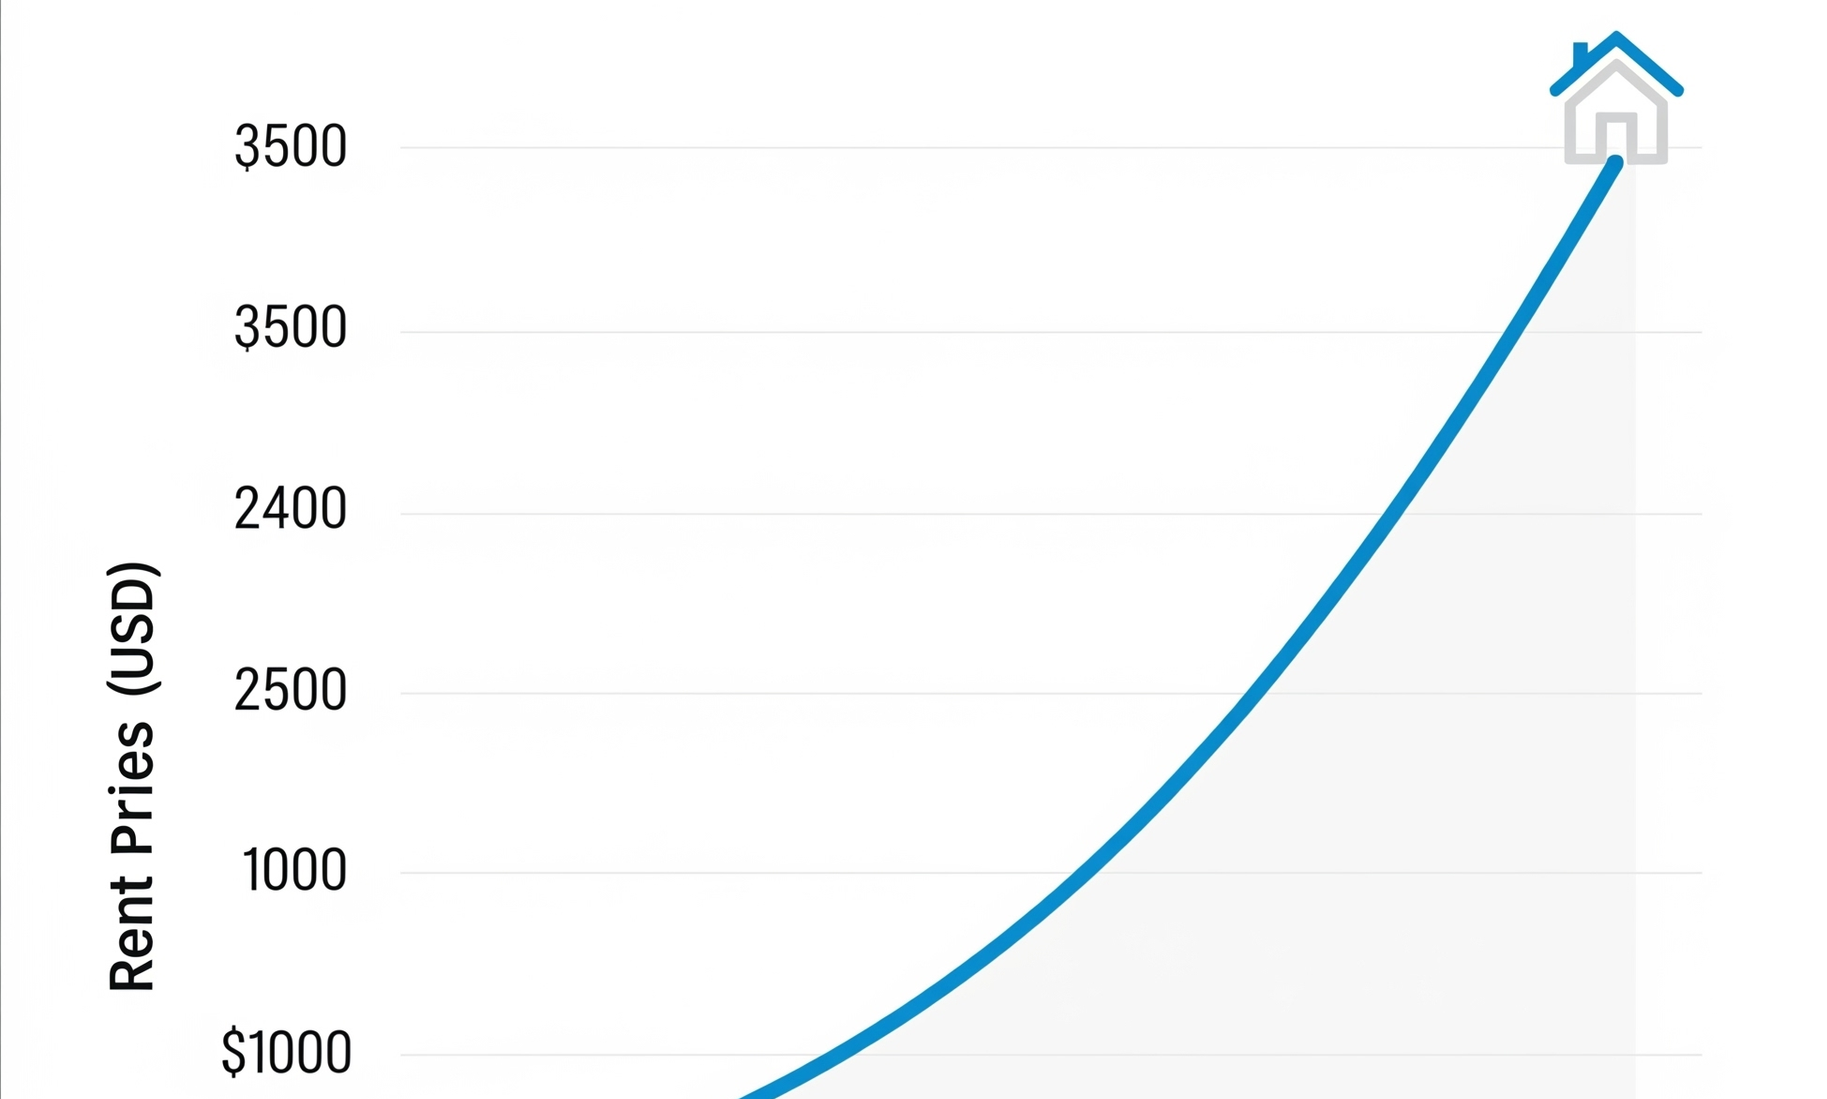
From January through May 2025, Bonsall rents rose about 2.6%. The community is known for rural living, vineyards, and its quiet, family-friendly neighborhoods.
Citywide Rent Growth (Jan–May)
Average Rent by Bedroom (May 2025)
| Unit Type | Median Rent | MoM Change | YoY Change |
|---|---|---|---|
| Studio | $1,600 | +1.3% | +2.1% |
| 1 Bedroom | $1,900 | +1.6% | -2.8% |
| 2 Bedroom | $2,350 | +2.0% | -3.9% |
| 3 Bedroom | $3,000 | +1.2% | -4.5% |
Top Performing Areas
| Neighborhood | Median Rent | Trend |
|---|---|---|
| North Bonsall | $2,550 | +12.1% |
| Central Bonsall | $2,300 | +9.7% |
| South Bonsall | $2,100 | -3.8% |
“Bonsall’s rental market benefits from rural appeal and steady demand among families.” – Seabird Property Management
Explore more rental trends and get property management support at www.seabirdmanagement.com.
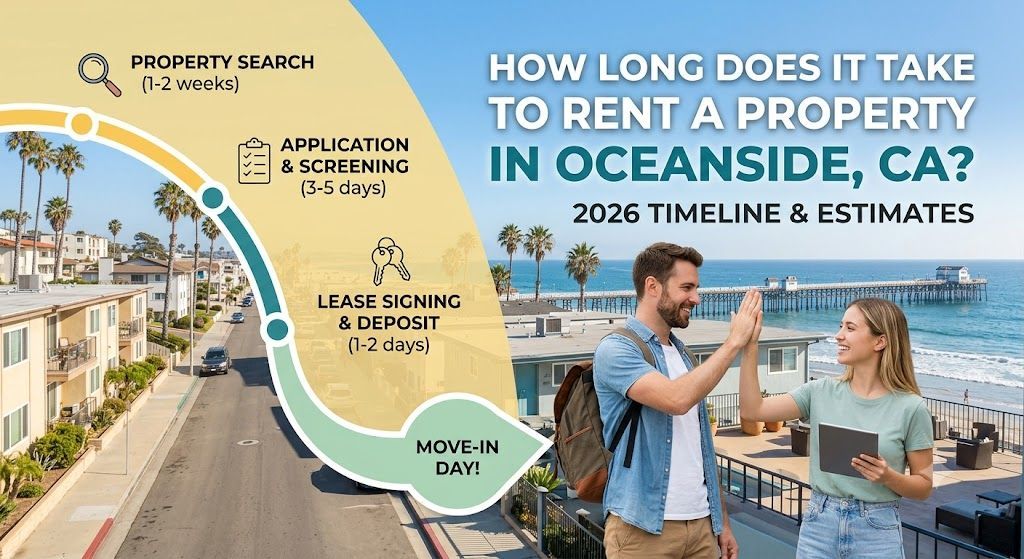
How Long Does It Take to Rent a Property in Oceanside 2026

A landlord's guide to the eviction process in San Diego. Learn about legal grounds, the step-by-step process, and key considerations to protect your property.

Oceanside Rental Market 2026
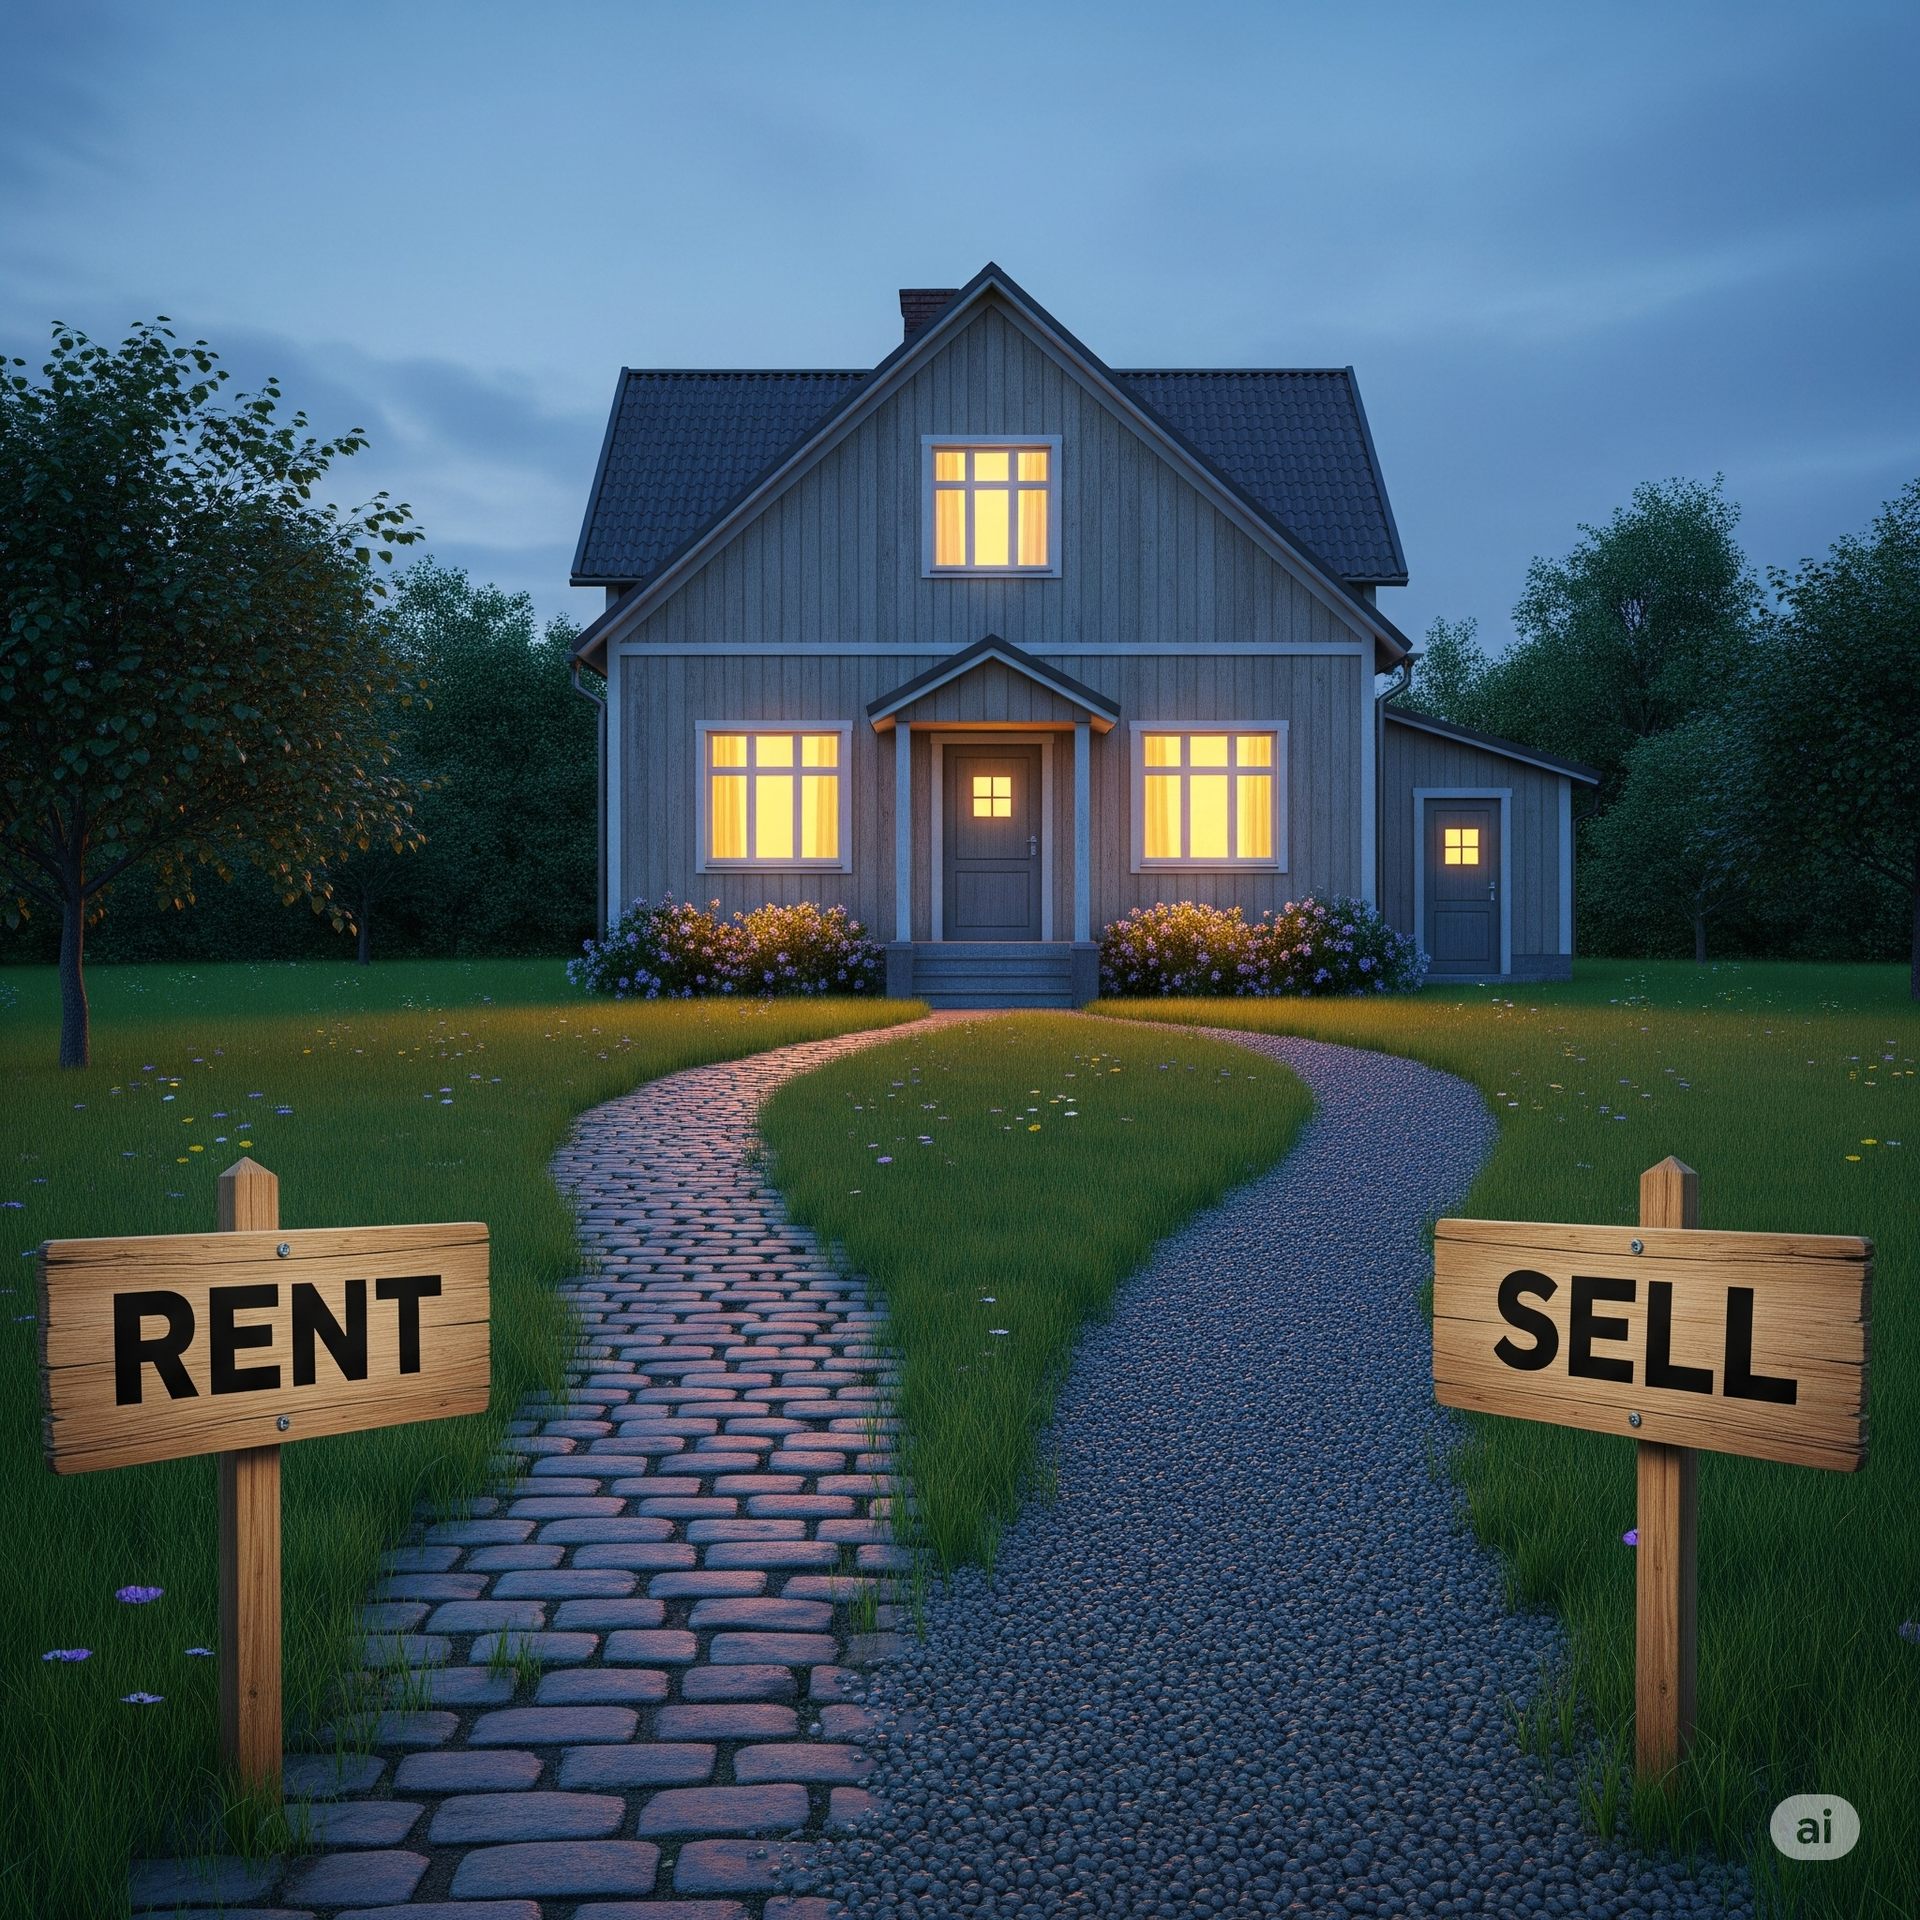
Should you rent or sell your property in Oceanside, CA? Get expert insights on market trends and smart strategies from Seabird Property Management.

Why Use Seabird Property Management Services?

Top tips for Oceanside landlords to maximize success. Learn about compliance, tenant screening, and property management strategies.

Struggling to rent your property? Discover how a professional market analysis can help you price your home correctly, reduce vacancy, and maximize your rental income

Why saying yes to pets can increase your rental income, attract more tenants, and more stable leases. Discover the surprising benefits of a pet-friendly policy.

Discover the top property management companies in Oceanside, CA. Compare services, reviews, and why Seabird Property Management ranks among the best.

Get the latest Oceanside rental market update. Explore rent trends, pricing, vacancy rates, and insights to help maximize your rental performance.